Dashboard/Visualization
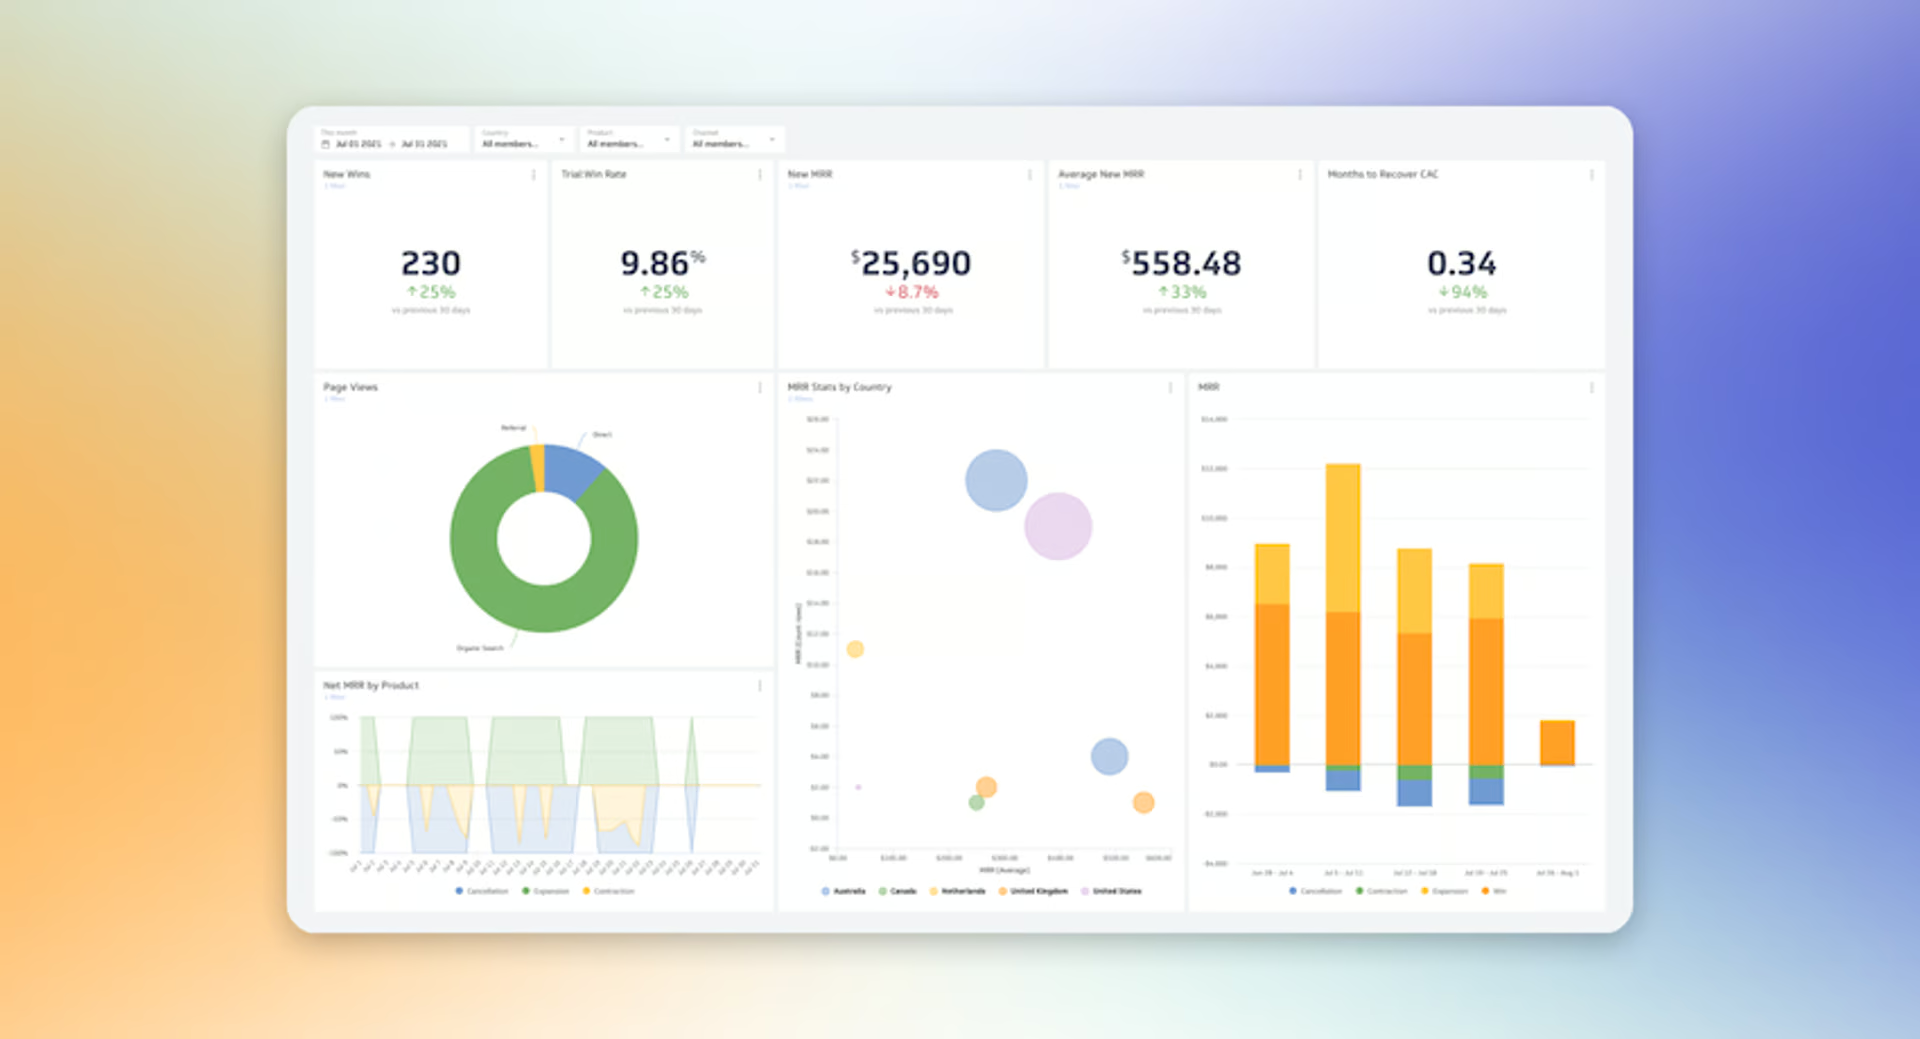
A comprehensive dashboard I created to replace laborious spreadsheet-using meeting during my tenure at HistoGenetics. I employed Streamlit, Plotly, and various data transformation to fit stakeholder's needs.
This portfolio highlights projects that demonstrate my skills in analyzing complex datasets, building scalable pipelines, and applying machine learning. Thank you for visiting—I’m excited to share my work with you!
A comprehensive dashboard I created to replace laborious spreadsheet-using meeting during my tenure at HistoGenetics. I employed Streamlit, Plotly, and various data transformation to fit stakeholder's needs.
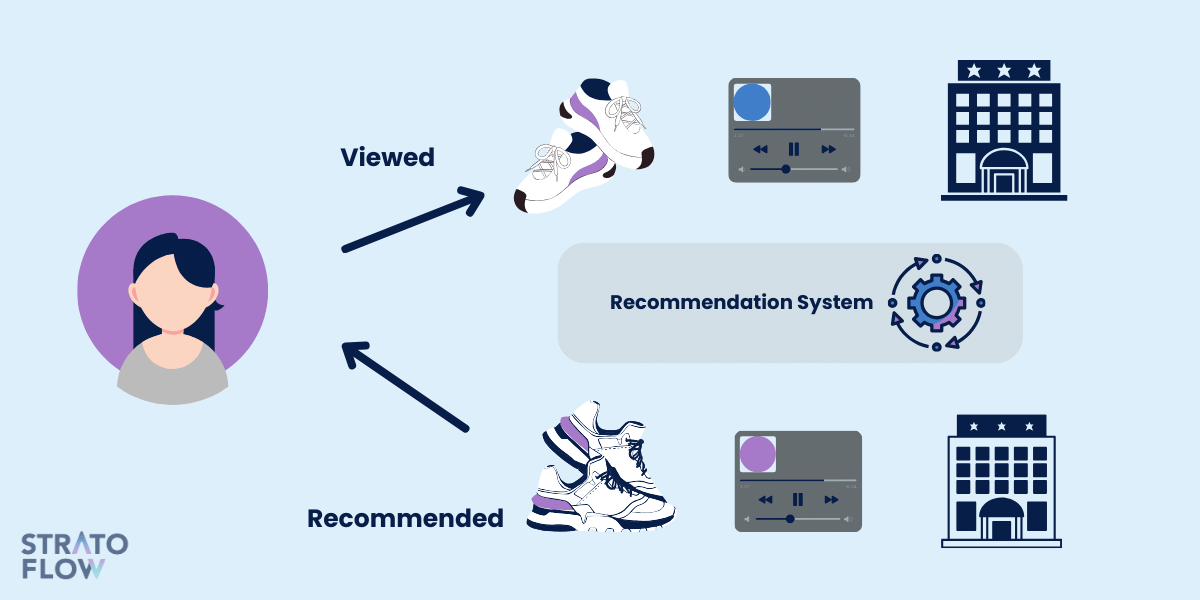
A recommendation system that combines Collaborative Filtering and Machine Learning with an emphasis on scalability via usage of Spark and XGBoost.
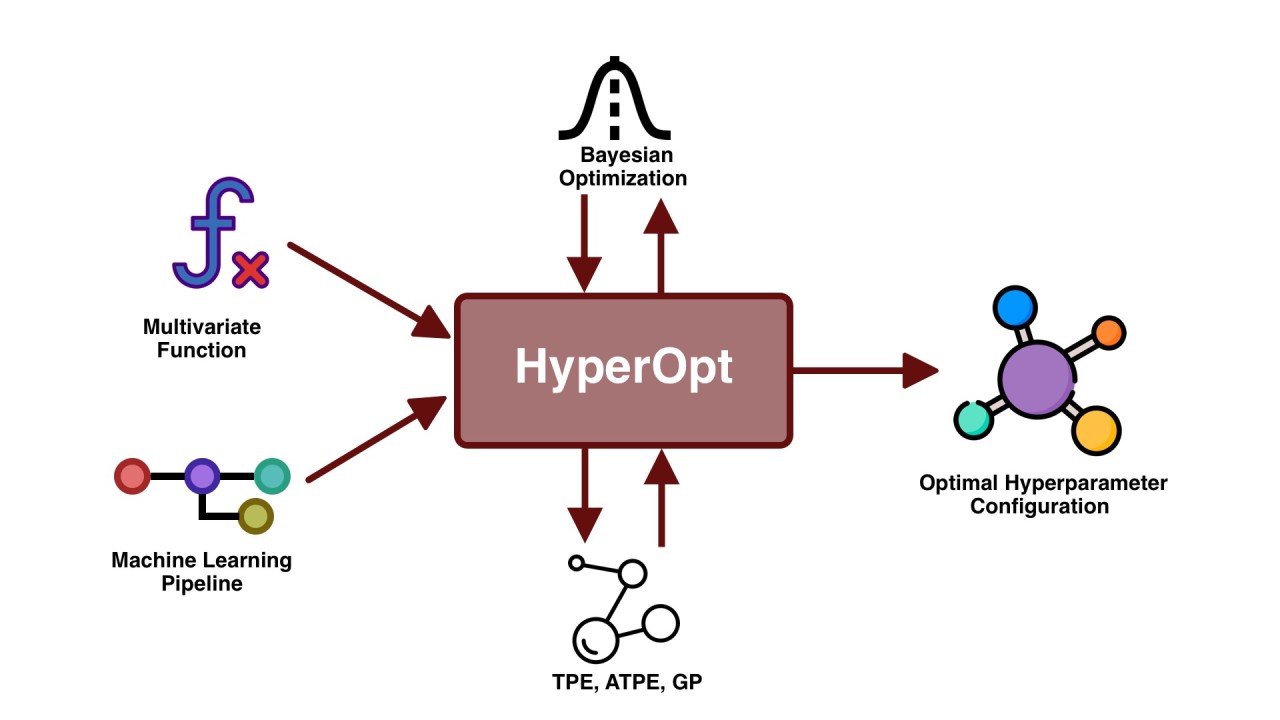
A model optimization by comparing between supervised, unsupervised, and semi-supervised and adjusting relevant hyperparameters to achieve maximum and relevant metric score.
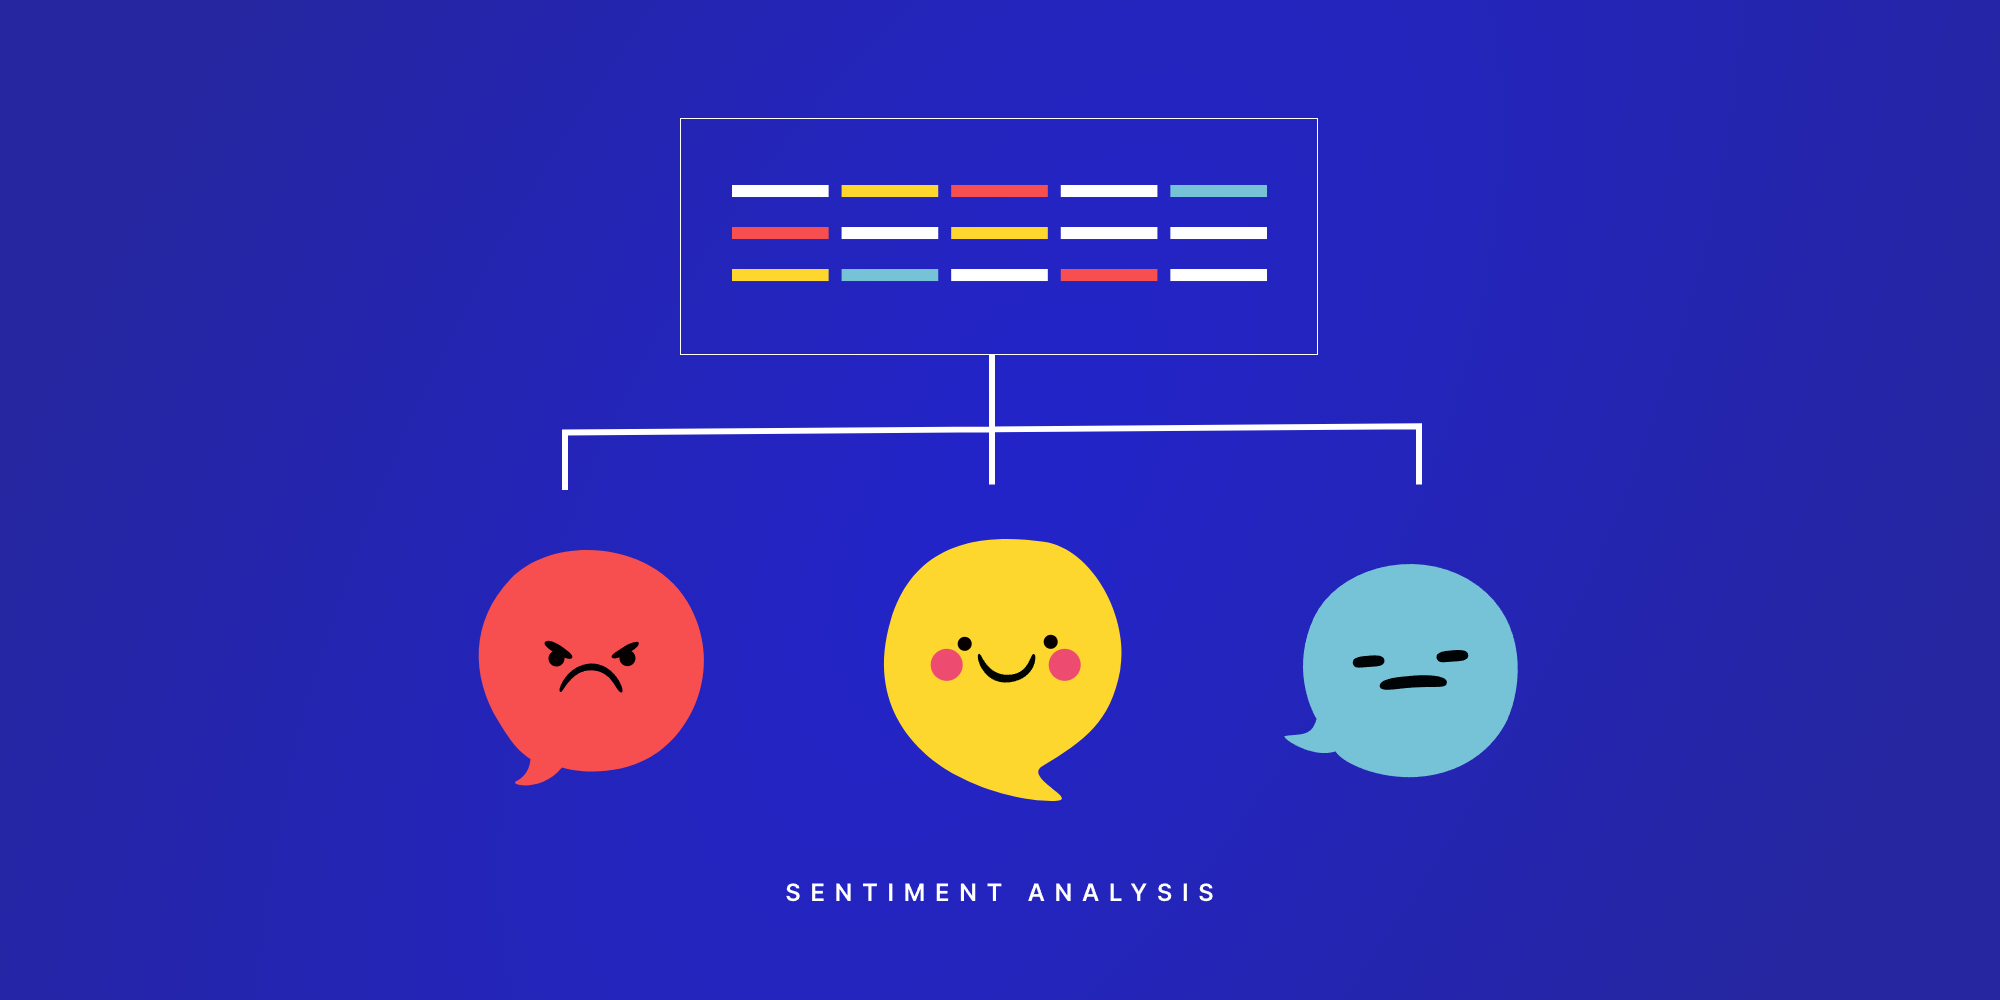
Employing cutting-edge techniques like Tokenization and Vectorization, techniques used in modern LLM, to perform Sentiment Analysis by building a neural network.
Implementation of Bloom Filtering and other advanced techniques that are used to check if an entry exists in a large-scale stream data situation.
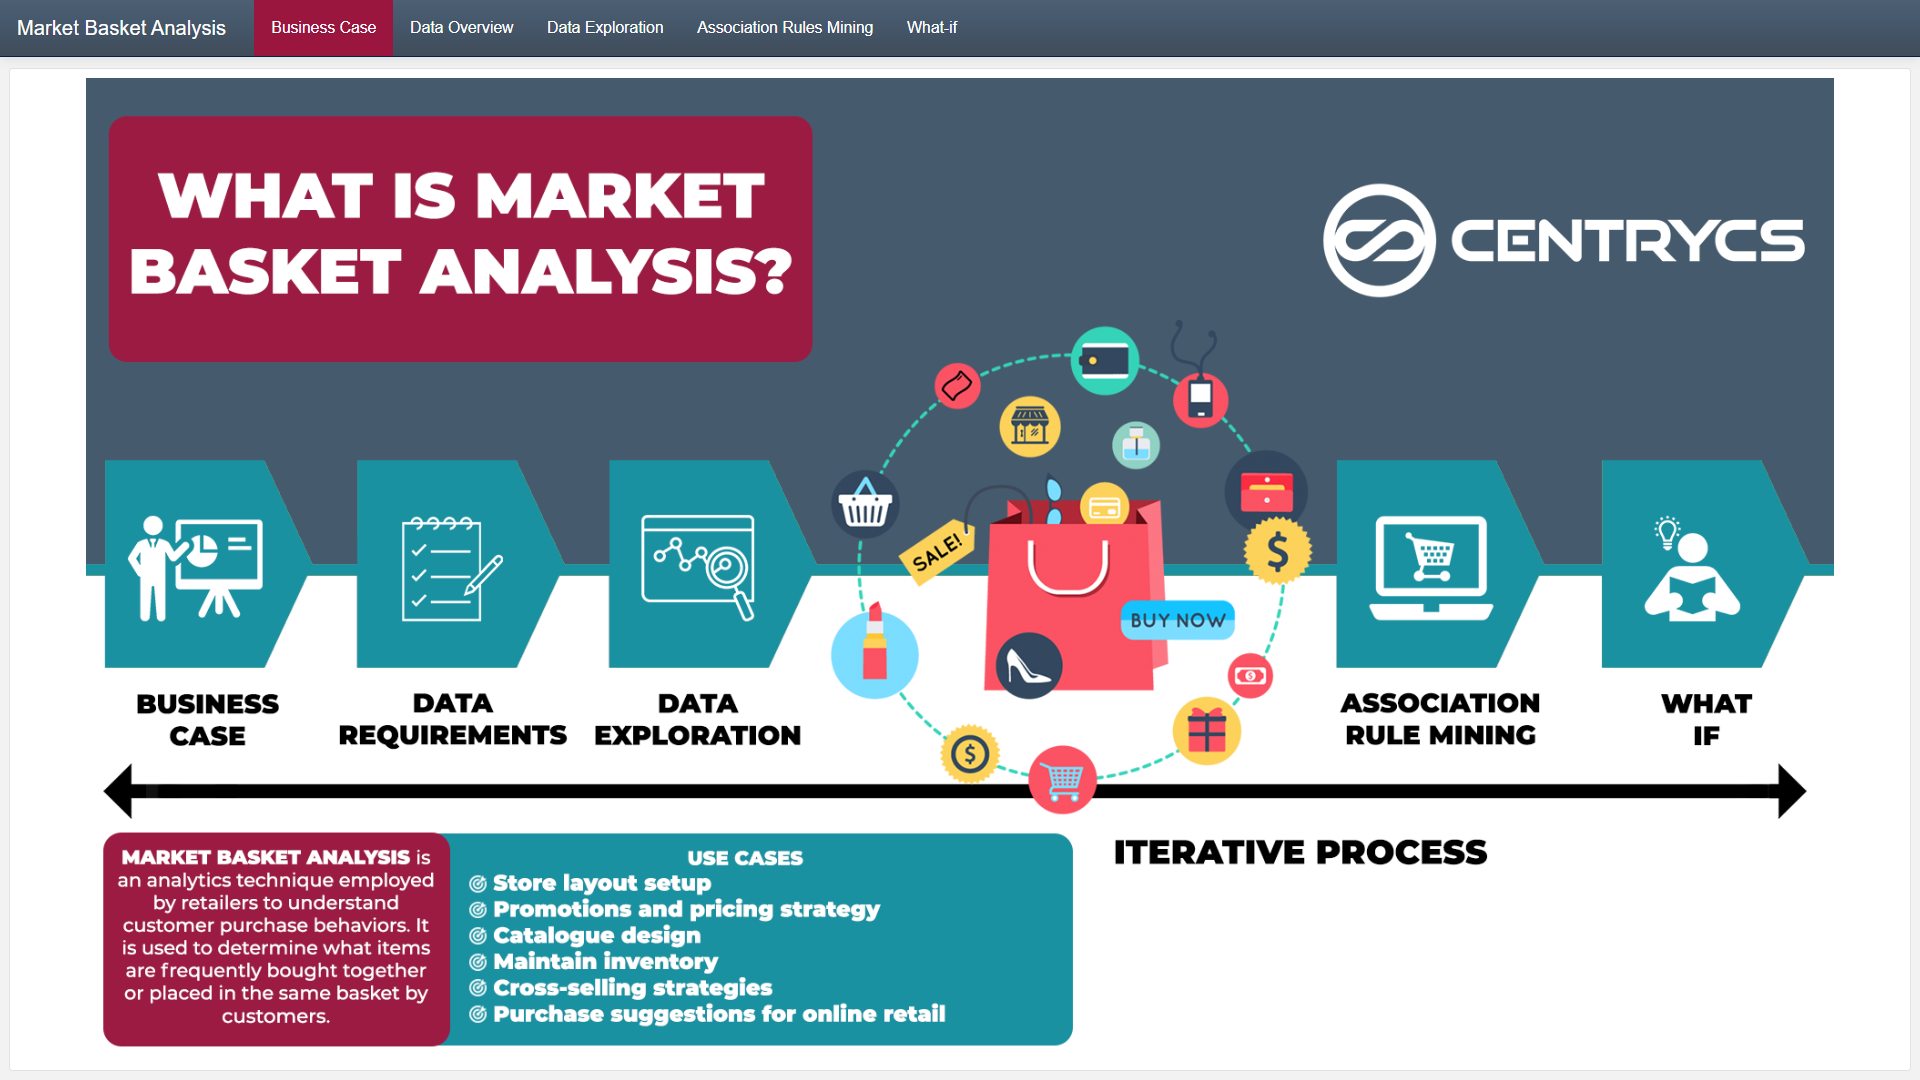
An implementation of scalable algorithm to detect potentially revenue maximizing insights when the data cannot fit in memory using Spark and Python.
Experience in predictive modeling, feature engineering, and model deployment using Python, Scikit-Learn, TensorFlow, and PyTorch.
Proficient in supervised and unsupervised learning, time-series forecasting, and statistical analysis.
Building scalable ETL pipelines using SQL, Apache Spark, and Google Cloud Platform (BigQuery, Dataflow, and Cloud Functions).
Experienced in data warehousing, streaming data processing, and optimizing database performance.
Proficient in multiple languages (English, Korean, Japanese) with the ability to seamlessly adapt to diverse cultures and professional domains, enabling effective collaboration across global teams and industries.
killed in cleaning, transforming, and structuring complex datasets to extract insights, leveraging tools like Pandas, SQL, and Apache Spark, and creating impactful visualizations using Matplotlib, Seaborn, and Plotly to drive data-driven decision-making.
I welcome any form of communication regarding new opportunities—feel free to connect and discuss how we can collaborate!